production analytics
member of the Linx Software Suite
features
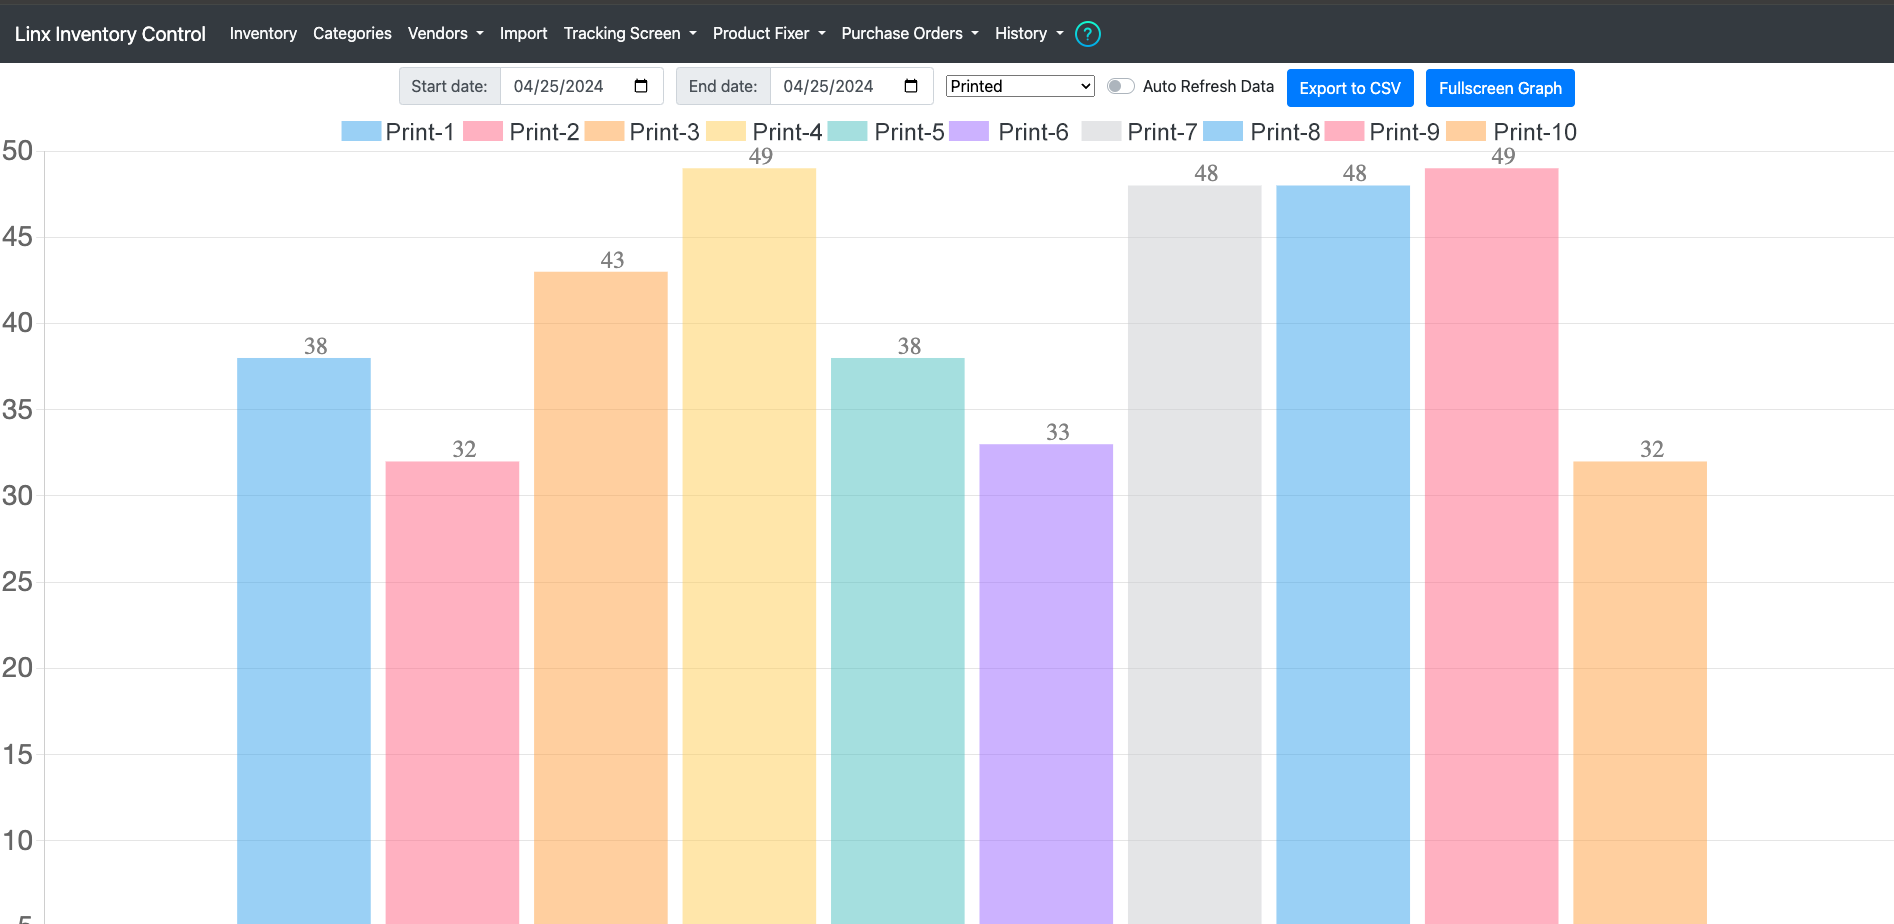
- Real time tracking of production machines
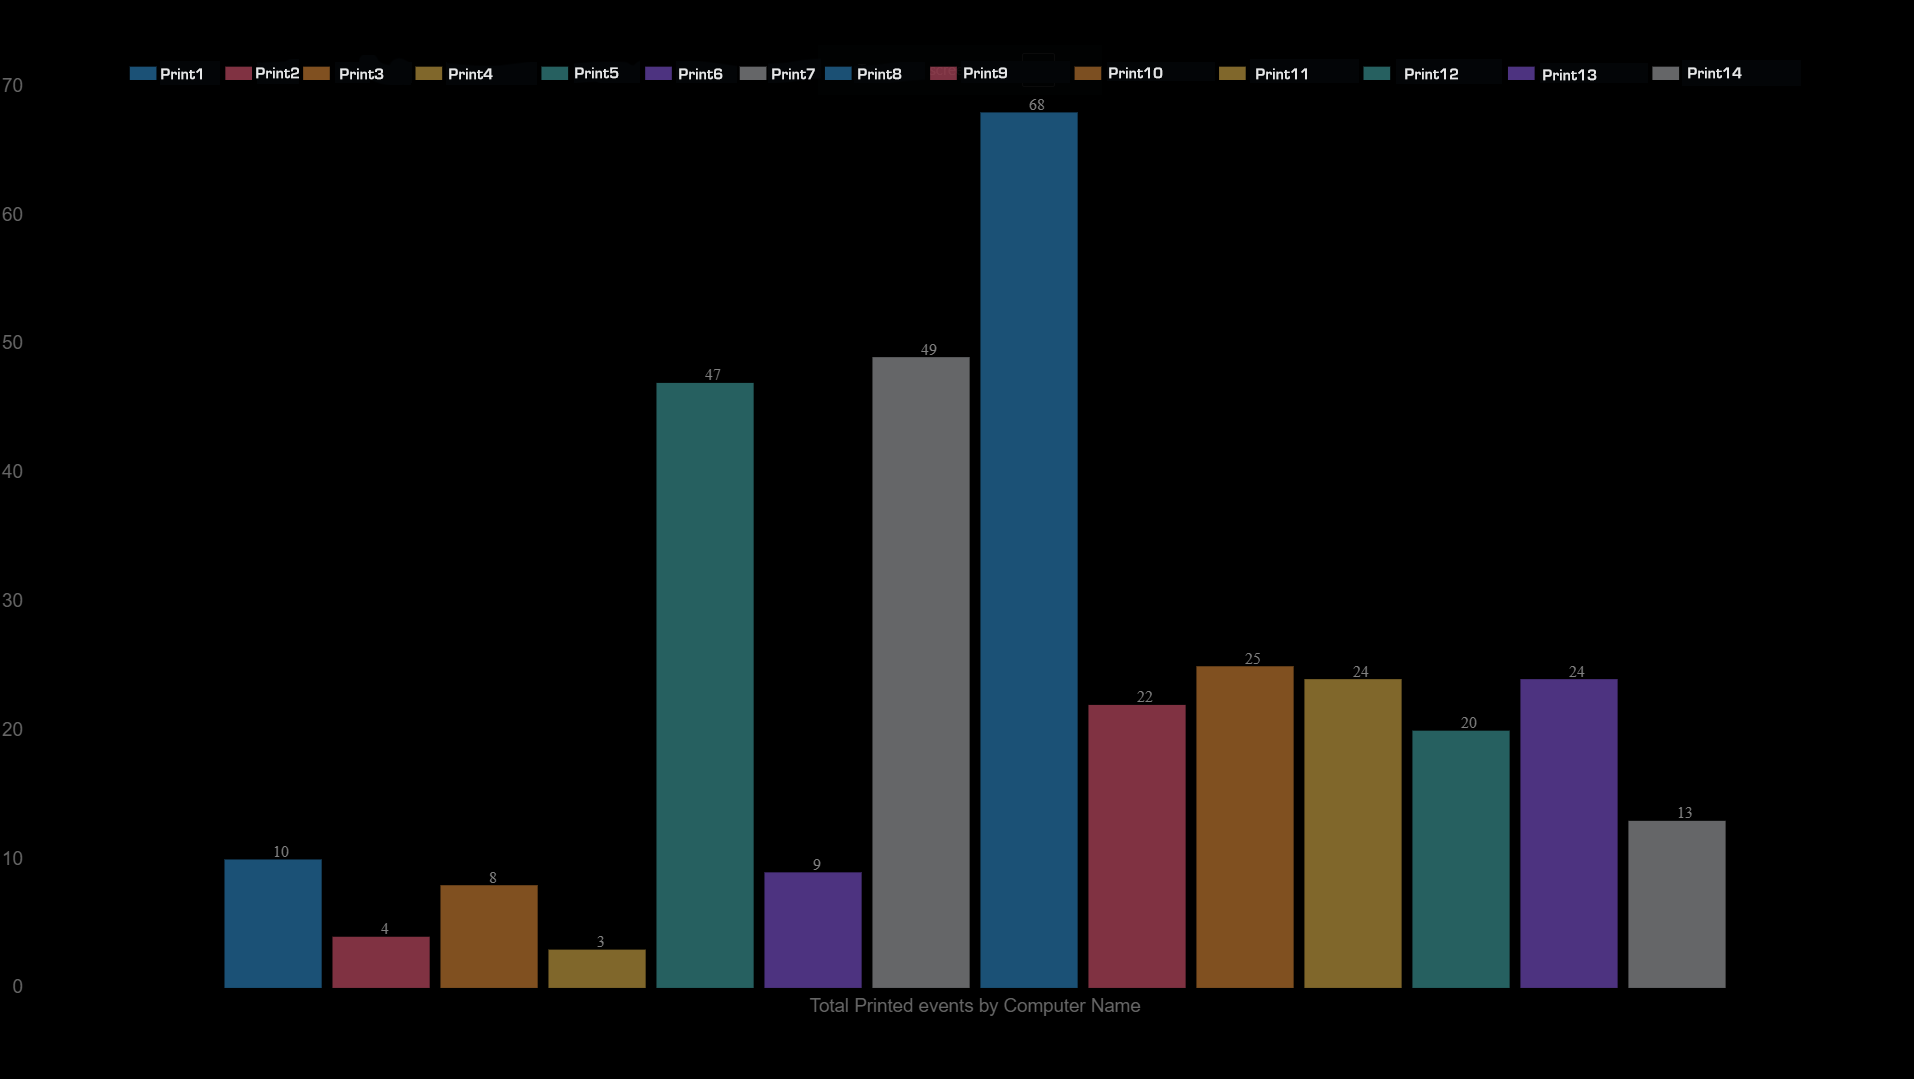
- Graphic representation for quick analysis
- View by many parameters
- CSV downloadable
Downloads
The Linx Analysis package allows for real time graphic representation of the production flow and volume of all stations in the production floor work flow. See and compare all machines volume output thru adjustable parameters such as date range. A graph compares each station side by side which allow an understanding of work flow bottle necks.
All of the information pulled into the Analytics graphing is available for regular downloads as a CSV file. This gives historic data to assist in production planning and organizing.
